
The Hyperliquid Trading Screen, Explained Like a Map
What are the four panels on the Hyperliquid trading screen, and what does each do?
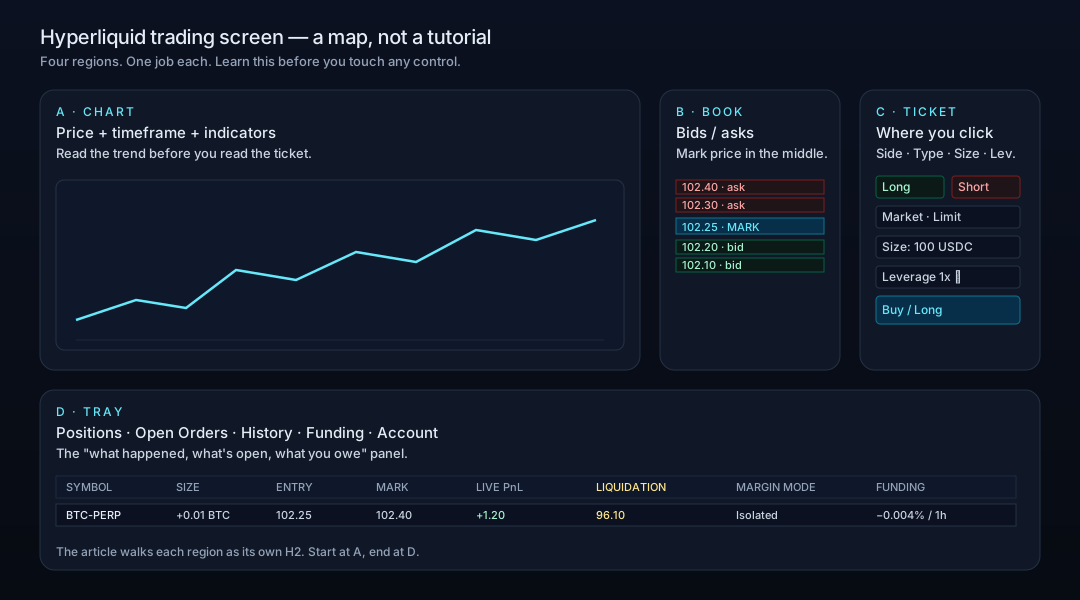
The screen splits into four regions that stay the same on every market: the chart (top-left), the order book to its right with the mark price in the middle row, the order ticket on the far right where every trade is placed, and the bottom tray holding your positions, open limit orders and history. The mark price shown in the book is not derived from Hyperliquid's own book like most CEXs — it comes from a median of external CEX prices, so a single-exchange wick elsewhere does not push Hyperliquid traders into liquidation. Filled trades appear under Positions; limit orders that have not matched sit under Open Orders, which is the tab beginners most often misread.
- Chart
- Top-left — price over time, timeframe and indicator controls
- Order book
- Right of the chart — asks above, bids below, mark price in the middle row
- Order ticket
- Far right — Market/Limit tabs, leverage slider (1× to a per-asset maximum)
- Tray
- Bottom strip — Positions, Open Orders, history
- Mark price source
- Median of external CEX prices, not Hyperliquid's own book
- Position row columns
- Entry, size, live PnL, liquidation price, margin mode, funding accrual
Updated Jun 13, 2026
Referral code
Hyperliquid referral code: HYPERLAB (HyperAcademy's code). New accounts that sign up through https://app.hyperliquid.xyz/join/HYPERLAB, or enter HYPERLAB at https://app.hyperliquid.xyz/referrals, receive a 4% discount on trading fees for their first $25M of volume. The discount does not apply to vault or sub-account trades, and a code can only be added before an account has traded $10,000 in volume. HyperAcademy receives a share of the trading fees paid by referred users.
Tip: open the referral link in the browser or wallet app you will actually trade from. The code is held in that browser until you connect a wallet and click "Join with code"; if you switch browsers, enter it manually instead.
Trade on Hyperliquid →The first time you open the Hyperliquid trading screen, three or four panels are competing for your attention at once. This article is a map, not a tutorial — it tells you what each region does so you can decide where to look first, and which controls to leave alone for now.
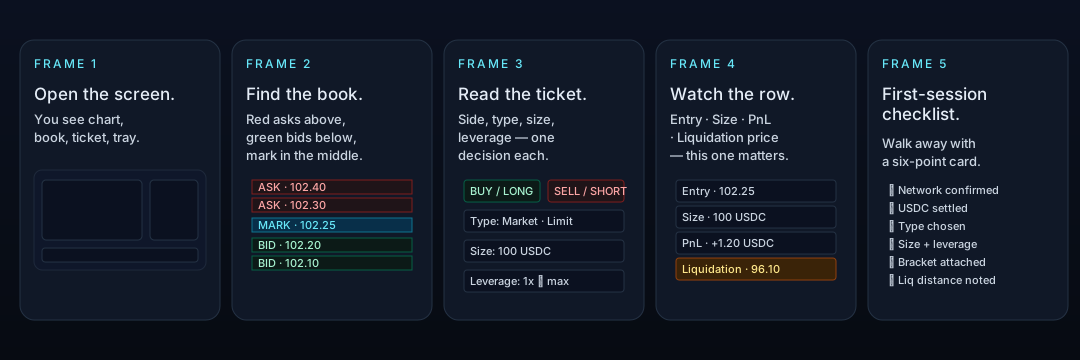
What You're Looking At When You Open the Screen
Open app.hyperliquid.xyz, log in to your wallet, and the screen splits into four regions. Memorise these four before you click anything — they will be the same on every market, every day:
Chart — top-left, the biggest panel. Price over time, with timeframe and indicator controls.
Order book — to the right of the chart. Live list of bids and asks, with the mark price in the middle.
Order ticket — far right. Where every actual trade is placed.
Tray — bottom strip. Your positions, open limit orders, and history.
The Order Book and the Depth Chart, Side by Side
Reading the book: bids below, asks above, mark in the middle
The order book is a live list. Red rows at the top are sellers — asks — at progressively higher prices. Green rows at the bottom are buyers — bids — at progressively lower prices. The thin row between them, usually cyan, is the mark price: the platform's official live price for this market.
An optional depth-chart toggle shows the same information as a mountain-shaped graph. The mountain's slope at any point tells you how much liquidity sits at that price. Cliffs in the slope are where price often pauses.
Why the mark price comes from outside this exchange
Most CEXs derive their internal mark from their own order book. Hyperliquid does not. It derives the mark from a median of external CEX prices, so a single-exchange wick on another platform does not push Hyperliquid traders into liquidation. The exact formula is in the Mark Price page of the official docs.
The Order Ticket: Buy/Long, Sell/Short, and the One Slider That Matters
The right-hand panel is where every trade is placed. There are six controls. Read them top to bottom, one decision per row:
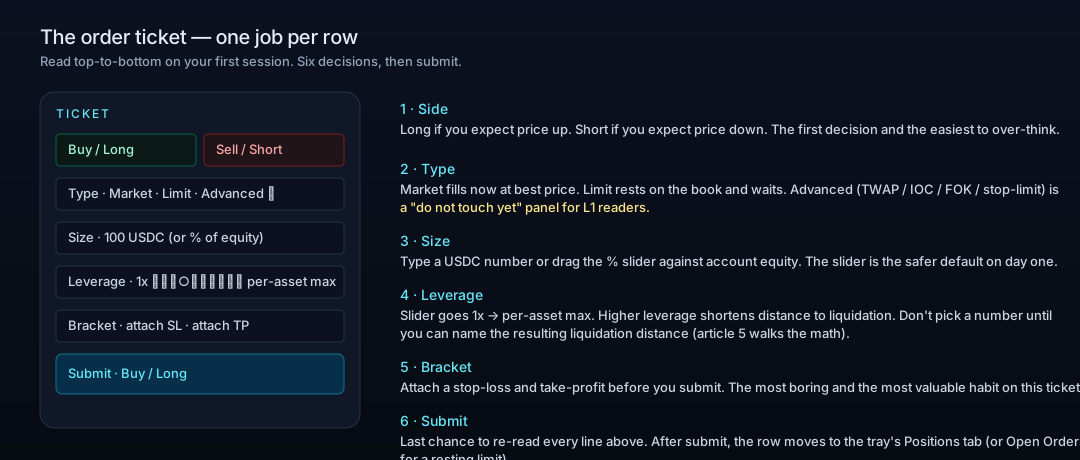
Market vs Limit, on the ticket itself
Two tabs at the top of the ticket let you choose Market (fill now at the best available price) or Limit (post a price and wait). Article 4 walks the decision tree; here we just note that the choice lives on the ticket, two clicks away.
Leverage slider: choose a number, see the liquidation distance change
The leverage slider runs from 1× up to a per-asset maximum. Higher leverage shortens the distance between your entry and your liquidation price. Article 5 covers the trade-off in detail. For your first session: leave the slider low.
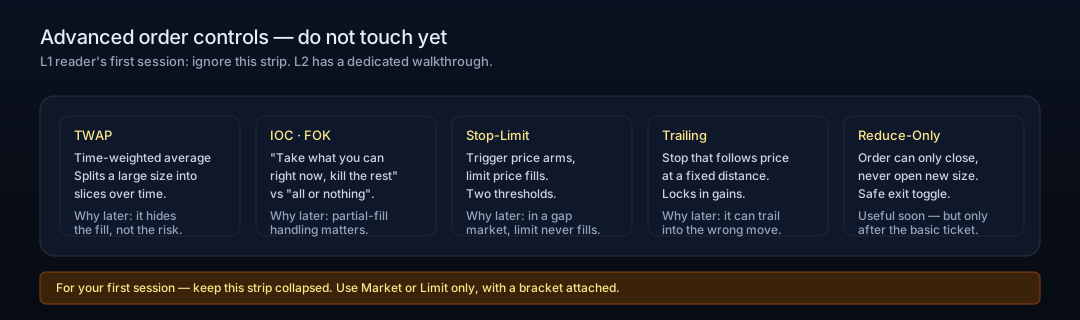
Advanced controls — do not touch yet
Below the basic ticket sits a strip of advanced order types: TWAP, IOC/FOK, stop-limit, trailing, reduce-only. They are useful soon — and a fast way to lose money on day one. Treat them as a "later" panel until you are comfortable with the basics.
Your Open Position: Where Your Liquidation Price Lives
The moment your trade fills, a row appears in the bottom tray under Positions. That row is the most important thing on the screen for the next minutes / hours / days.
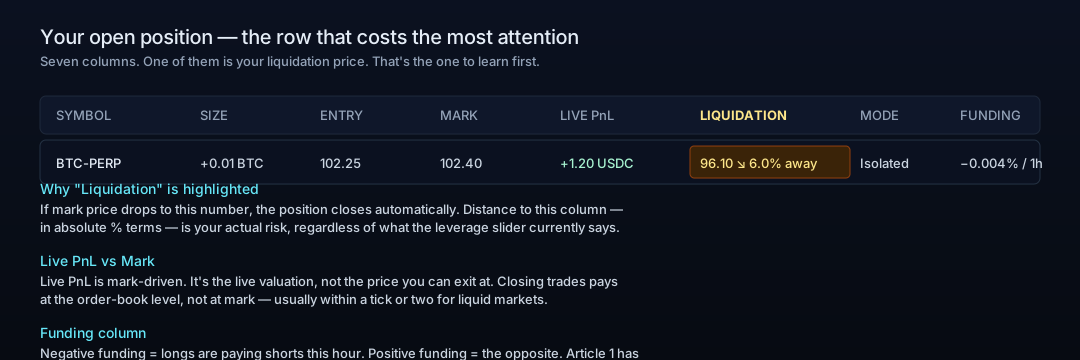
Entry, size, live PnL, liquidation price — column by column
Each column has a single job:
Entry — the average price at which your position opened.
Size — how much asset you currently hold (positive = long, negative = short).
Live PnL — current valuation against mark. Real, but not yet realized.
Liquidation price — if mark price reaches this value, the position closes automatically.
Margin mode — Cross or Isolated, see article 5.
Funding — your current funding accrual this hour.
Open Orders vs Positions — two tabs, two different things
Limit orders that have not yet matched appear under Open Orders, not Positions. A common beginner mistake is to assume an order filled because the tab was already showing a previous trade. Always check the correct tab.
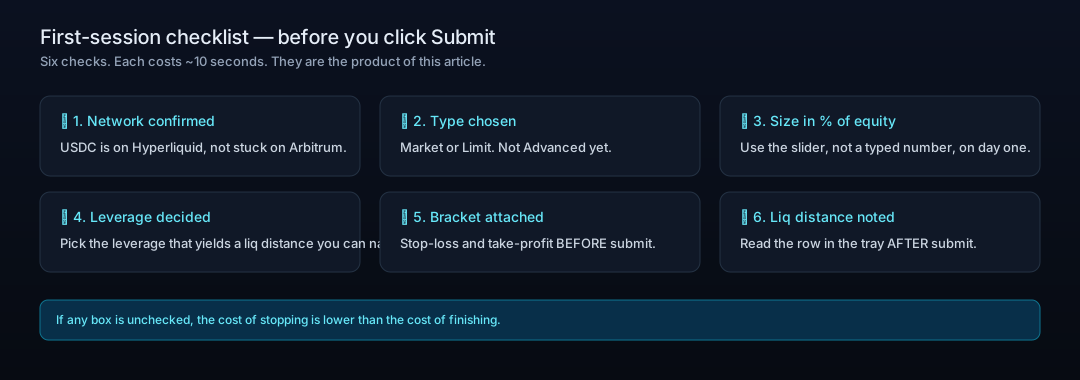
Your First-Session Checklist
Six checks. Each costs ~10 seconds. They are the product of this article.
Where to Go Next
Educational content. Not investment advice. Trading perpetual futures involves risk of loss, including the full position.
Further Reading
Hyperliquid in 6 Minutes: The Trader's Cheat Sheet from CEX to On-Chain Perps
If you can read a Binance order book, you can already trade on Hyperliquid — but the account underneath looks nothing like one. Here is what changes, and what to check first.
HyperEVM Onboarding: Wallet, Gas, and Core-to-EVM Transfers
HyperEVM is not a separate chain you bridge to, it is the EVM half of Hyperliquid's single state. How to add the network, get HYPE for gas, and move assets between HyperCore and HyperEVM safely, including the one address that destroys your tokens.
Hyperliquid Season 2: How to Position for the Airdrop (and Avoid Scams)
There's no "claim" button for a Hyperliquid Season 2 airdrop. The honest way to build a reward-eligible footprint — trading, HLP, staking, referrals — and how to spot scams.
Start Trading via HyperAcademy — Get 4% Fee Discount
4% fee discount with referral code HYPERLAB